Same Age, Different Generation: What 30 Years of Treatment Data Says About How People Choose Rehab
Thirty years of national treatment data shows the age of people entering treatment barely moved, while how they find help changed completely. This article explores the research on how families find and choose behavioral health and recovery centers, the role of pre-decision trust, and what it means for your admissions funnel.
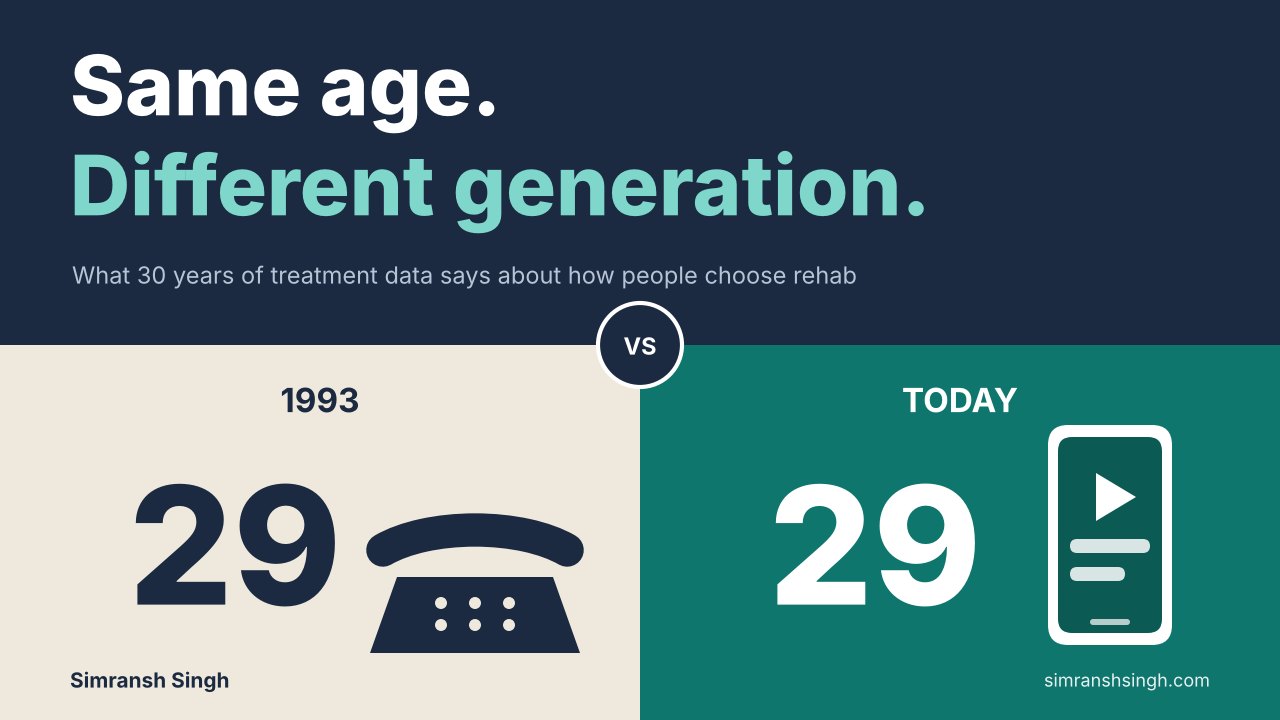
The two people in the opening scene are composites, not real patients.
Picture two people. Both are 29. Both are quietly sure they need help.
The first one lives in 1993. He has been drinking more than he admits for about two years. He doesn’t talk about it. What he has is a boss who noticed, a doctor he sees once a year, and a brother-in-law who went through a program a few years back. He might call the brother-in-law. He might call a number from a hospital. If he ends up in a program, he will have found it through a person or an institution, because there isn’t much else to find it through.
The second one lives today. She is 29 too, and she hasn’t told anyone either. But for months she has been on her phone late at night. She has watched a clinician explain withdrawal in a short video. She has read a thread where strangers describe their first week in treatment. She has searched two centers by name, read their reviews, and noticed which center’s therapist “sounded real.” By the time she picks up the phone, she has done weeks of research that nobody at any center ever saw.
Same age. Same need. A completely different road to the front door.
That contrast is what this article is about. And what makes it interesting is that the data shows something people don’t expect.
The Age Didn’t Drop. The Generation Did.
When I tell people that treatment centers are now serving a different audience, most assume the average patient got younger. The national numbers don’t say that.
SAMHSA, the federal agency that tracks this, collects data on treatment admissions through a system called TEDS. In its 1993 to 2003 comparison, the average age at admission was 33 in 1993 and 34 in 2003. Here is how the age groups looked:
| Age at admission | 1993 | 2003 |
|---|---|---|
| Under 18 | 6% | 9% |
| 18 to 24 | 14% | 17% |
| 25 to 34 | 40% | 25% |
| 35 to 44 | 28% | 30% |
| 45 and older | 12% | 19% |
Share of treatment admissions by age group, 1993 vs 2003. Source: SAMHSA, Trends in Substance Abuse Treatment Admissions: 1993 and 2003.
In 1993, 68% of admissions were between 25 and 44. In 2003 it was 55%, with more people entering at 45 and older.
And today? In SAMHSA’s 2022 report, about 1.5 million admissions were reported, and the biggest groups were ages 21 to 34 (37.1%) and 35 to 44 (28.3%). SAMHSA’s newest report, covering 2024 and released in 2026, counts nearly 1.6 million admissions, with ages 21 to 34 at 33.0% and ages 35 to 44 at 30.3%. SAMHSA now groups ages differently, so the bands don’t line up exactly with 1993 and 2003. But the neighborhood is the same. In 2024, 63.3% of people entering treatment were between 21 and 44, still roughly two-thirds. If anything, the 21 to 34 share has been shrinking: from 40.5% in 2020 to 33.0% in 2024.
So the age band hasn’t moved much. The people standing inside it have.
A person who was 25 to 34 in 1993 was born between 1959 and 1968. A person who is 21 to 34 today was born between 1988 and 2001. The 35 to 44 group in 2022 was born between 1978 and 1987. These are different generations with a different relationship to information, to institutions and to each other.
What Changed Was the World Around Those People
Here is how different the two worlds were.
In 1995, just 14% of American adults had internet access, according to Pew Research Center. By 2000 it was 52%. Today it is about 97%.
Pew began tracking social media in 2005. That year, about 5% of adults used it. By 2021, it was 72%. Among adults 18 to 29, 84% used it. Among those 30 to 49, 81%.
In 2011, 35% of adults owned a smartphone. By 2021, 85% did.
So the person who was 29 in 1993 had no internet at home, no social media and no phone that could search anything. The person who is 29 now has all three, and has had them since before they could drive.
This matters for how they look for help. Pew’s 2025 survey (published in April 2026) found that 36% of American adults get health information from social media, and 52% of adults under 30 do, at least sometimes. A KFF poll from July 2025 found that 55% of adults use social media at least occasionally to find health information, and 58% had seen mental health content on social media in the past month. A newer KFF poll, fielded in May 2026, puts the share of adults who use social media for health information at 60%.
We can’t say exactly how many people entering treatment first found their center on social media. Nobody collects that. But we can say that roughly eight in ten people in the main admissions age band use social media (Pew, 2021 data), and that about half of people under 30 go there for health information. That is where a lot of the quiet research happens.
Where Admissions Come From
The second shift is in the referral source. TEDS records who sent each person to treatment.
| Referral source | 1993 | 2003 | 2022 | 2024 |
|---|---|---|---|---|
| Self or individual (includes family and friends) | 36% | 34% | 48.4% | 50.4% |
| Criminal justice system | 33% | 36% | 24.8% | 24.6% |
| Alcohol or drug treatment provider | 13% | 11% | 9.6% | 9.4% |
Share of admissions with a known referral source, by referral source. Other referral sources are not shown. SAMHSA warns that changes across years can reflect which states report, so read the direction, not the exact gaps. Sources: SAMHSA, Trends in Substance Abuse Treatment Admissions: 1993 and 2003; SAMHSA TEDS 2022 and 2024 annual reports.
The in-between years add a wrinkle. In 2012, self or individual referrals were still 35.8%, so the jump came later. That is one reason I’d treat the direction as likely and the size of the gap as approximate. SAMHSA itself notes that apparent changes over time may reflect reporting differences rather than true changes in treatment patterns. Even so, the direction is clear.
One thing to understand about “self or individual.” In the TEDS definition, it includes the client themselves, a family member, a friend, or any other individual who isn’t an institution. That bucket is where word of mouth lives, and where a worried sister or spouse searching on someone else’s behalf lives.
In 1993, about 64% of admissions came through some kind of system: courts, other providers, schools, employers, community agencies. By 2022, that was closer to half, and in 2024 it was about the same. More of the front door is now opened by a person, not an institution.
So Is Word of Mouth Losing?
I went into this expecting the data to say yes. It doesn’t. If anything, personal referrals grew.
What changed is what happens after the recommendation. When a cousin says “you should look at this place,” the next thing people do is look it up. They read the reviews. They watch a video. They check whether the center looks like it was described. In a 2023 American Psychiatric Association poll about helping a loved one with addiction, 53% said they’d turn to a doctor and 51% to family. Online resources were named by 34%, and social media by 8% overall, and by 13% of ages 18 to 34 and 15% of ages 35 to 44. Social media is not usually the first stop. It is often the second, where a recommendation gets confirmed or quietly dropped.
And there’s a catch. People use social media for health information, but few trust it. KFF found that fewer than one in ten social media users say they trust most of the health information they see there. Among people who use social media for health information, 36% said in KFF’s May 2026 poll that a major reason is wanting to learn from people with the same condition or similar experiences, and 44% of adults 18 to 29 said so.
Put those two facts together. People are looking in places they don’t fully trust, hoping to find someone who sounds real. That gap is an opening for any center willing to be useful and human in public.
A Short History of How Centers Got Found
1970s and 1980s: The field grew fast. A NAATP presentation put the number of treatment programs at 500 in 1973 and 2,400 in 1977. In 1982, the Betty Ford Center opened and made recovery publicly visible in a new way. Referrals ran through employers, doctors, courts and word of mouth.
1990s: Reports of fraud led to a clampdown on insurance coverage for treatment, according to WHYY’s reporting on the era.
2000s: The internet became the default place to start. By 2000, 52% of adults were online.
2010s: Smartphones and social media took over. Paid search became the main battlefield. Then in September 2017, Google suspended addiction treatment ads after reports of deceptive advertisers. In August 2018, ads returned, but only for centers certified by LegitScript.
2018 to now: In July 2018, a House subcommittee held a hearing on advertising and marketing practices in the industry. The federal anti-kickback law for recovery services (EKRA) took effect that October, and Congress also gave the FTC civil-penalty power over deceptive practices by treatment providers through the Opioid Addiction Recovery Fraud Prevention Act of 2018. In 2023, 2024 and 2025, the FTC acted against BetterHelp, Cerebral, Monument and Evoke Wellness over privacy and deception.
Look at that arc. Each decade added a new way to reach people, and each one eventually added new rules and new skepticism. Families have learned to be careful. They have seen the headlines.
What This Means for Pre-Decision Trust, Intake Friction, and Cost
Here is the chain of logic, and I’ll mark where it is reasoning and not measured data.
- More admissions now start with a person, a friend, a parent, a spouse. (Measured: TEDS.)
- That person, and the one who needs help, usually checks the recommendation online before calling. (Reasoned from the survey data above, not directly measured.)
- What they find during that check is either a stranger or someone they feel they already know. (This is the part centers can influence.)
- A center that has been useful in public, with clear answers and visible clinicians, arrives at the first call already trusted. That tends to mean a shorter first conversation, fewer “I need to think about it” drop-offs and less need to buy attention again for every admission. (Reasoned.)
I can’t give you a precise cost-per-admission figure from this data, and I won’t invent one. What the data supports is the direction: the more of the decision that gets made before the call, the more your content, and not your ad budget, decides who calls.
That is pre-decision trust. It is the trust a family builds in a center before they ever speak to anyone there.
What the Data Can’t Tell Us
- TEDS counts admissions, not people. Someone admitted twice counts twice.
- TEDS mostly covers programs that receive public funding or are licensed by state agencies. Private, commercial and cash-pay programs are less visible in it.
- “Self or individual” blends the patient with family and friends.
- Referral percentages leave out admissions where the referral source is unknown, which was about one in five records in 2024.
- TEDS has no field for “how did you find us.” No national dataset does.
That last gap is something you can fix inside your own center. Add one question to intake: “What did you see or read before you called us?” Keep it free of patient health details. Over a few months, you will have better data about your own funnel than any national report can give you.
Five Things to Do With This
- Treat the family member as an audience. Parents, siblings and spouses are doing much of the searching. Write for them as well as for the person who needs help.
- Build for the research stage. Clear answers to the questions families ask, in plain words, in places they look: search, video and social.
- Show real humans. Clinicians explaining things simply do more for trust than a polished brand video.
- Make the first call easy. The research stage ends at a phone or a form. If either one is slow or cold, the trust you built leaks.
- Measure where trust came from. Ask at intake and write the answers down.
The people entering treatment today are about the same age as the people who entered 30 years ago. Everything around them is different. The centers that understand that will stop asking how to get more clicks, and start asking what a family needs to see before they feel safe calling.
See Where Families May Be Dropping Off at Your Center
If families check you out before they call, the first thing they find matters. Book a free 15-minute call and we will look at what they find, and where they may be leaving.

Simransh Singh builds organic acquisition systems for behavioral health and recovery centers. Connect on LinkedIn.
Sources
- SAMHSA, The DASIS Report: Trends in Substance Abuse Treatment Admissions, 1993 and 2003 (2006).
- SAMHSA, TEDS annual reports: 2022 and 2024 (released 2026).
- Pew Research Center, Internet and Broadband Fact Sheet and Social Media Fact Sheet; Social Media Use in 2021.
- Pew Research Center, health information survey (fielded October 2025, published April 2026).
- KFF, Tracking Poll on Health Information and Trust: Health Information and Advice on Social Media (July 2025), and Use of Social Media and AI for Health Information and Advice (fielded May 2026).
- American Psychiatric Association, Healthy Minds Monthly poll (August 2023).
- NAATP, National 2017 conference presentation; WHYY, reporting on drug treatment investment.
- Search Engine Land, Google and LegitScript certification (2018); Fortune, Google allows rehab ads again (August 2018).
- US House Energy and Commerce Subcommittee on Oversight and Investigations, hearing on advertising and marketing practices in the substance use treatment industry (July 24, 2018); overview of EKRA (effective October 24, 2018).
- FTC actions: BetterHelp (2023); Monument and Cerebral (April 2024); Evoke Wellness (complaint January 2025, settled June 2025).
This article is general information and not legal advice.